Fugacity of a Single Component: Interactive Simulations
The first and third simulations were prepared using Mathematica. Download the free Wolfram player, and then download the simulation CDF file (link given below or click on figure to download). The middle simulation will work on your browser. Try to predict the behavior when a parameter changes before using a slider to change that parameter. Screencasts below explain how to use these simulations.
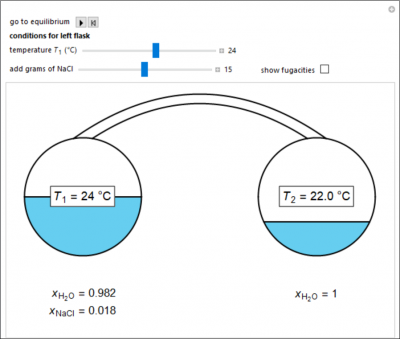
Two 1-liter flasks are at different temperatures; the left flask contains water with dissolved salt and the right flask contains pure water. You can control the temperature of the left flask and the amount of salt dissolved with the sliders. Select the reset button and then select play (“go to equilibrium”). Water transfers from one flask to the other to try to make water fugacities equal in each flask. For some conditions, all the water transfers to the left or right flask. Check “show fugacities” to display the water fugacities in each flask.
Try to answer these questions before determining the answer with the simulation. We suggest that you write down the reasons for your answers.
- For a system at equilibrium with water and salt in the left flask and only water in the right flask, what happens when the temperature of the left flask increases?
- For a system at equilibrium with water and salt in the left flask and only water in the right flask, what happens when more salt is added to the water in the left flask?
Single-Component Fugacity

Try to answer these questions before determining the answer with the simulation. We suggest that you write down the reasons for your answers.
- As the pressure increases for a single component, how does the fugacity of the gas change if the gas is not ideal?
- As temperature increases for a single-component liquid at 0.1 bar pressure, what approximately is the maximum fugacity that the single component can have?
The Peng-Robinson equation of state (EOS) is used to calculate the fugacity, \(f\), and the fugacity coefficient, \(\phi \), for pressures and volumes which can be selected by sliders. The fugacity coefficient indicates how much the fluid deviates from ideal-gas behavior; it equals 1 for an ideal gas. Isotherms are shown on the P-V diagram when you select “isotherms” from the drop-down menu. The constant temperature region inside the phase envelope is represented by a solid horizontal line.
Try to answer these questions before determining the answer with the simulation. We suggest that you write down the reasons for your answers.
- Make an estimate for the fugacity of water that is in vapor-liquid equilibrium at 1.0 MPa pressure.
- In the vapor region at pressures near the critical pressure, does the fugacity coefficient increase or decrease if the volume is increased at constant pressure?


