McCabe-Thiele Diagrams: Interactive Simulations
These simulations were prepared using Mathematica. Download the free Wolfram player, and then download the simulation CDF file (link given below or click on figure to download). Try to predict the behavior when a parameter changes before using a slider to change that parameter. Screencasts below explain how to use these simulations.
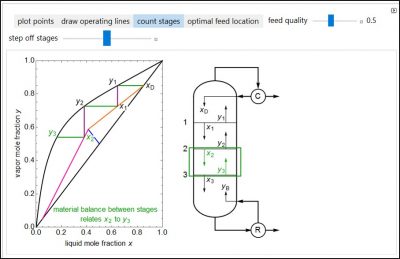
This Demonstration shows how to use the McCabe–Thiele method to determine the number of equilibrium stages needed to separate a binary mixture (methanol and water) in a distillation column. First, select “plot points” to show the location of the feed, distillate and bottoms compositions on the x-y diagram. The methanol feed mole fraction is \(z_F\) = 0.5, the desired methanol mole fraction in the distillate is \(x_D\) = 0.85, and the desired methanol mole fraction in the bottoms is \(x_B\) = 0.05. Next, select “draw operating lines” to set the feed quality with a slider and plot the operating lines for the feed, rectifying and stripping sections. The diagram on the right shows a representation of part of the distillation column and explains the equations used for the operating lines. Then, select “count stages” and use the slider to step off stages and draw lines for each stage; the diagram on the right highlights the corresponding location on the column. The partial reboiler is considered an equilibrium stage. The green horizontal lines on the x-y diagram result from a material balance between stages. The purple vertical lines correspond to vapor-liquid equilibrium (VLE) on each stage. Finally, select “optimal feed location” to determine where the feed should enter the column; the feed should enter above the stage where the rectifying and stripping sections meet. Mouse over the stage numbers on the x-y diagram to see to which section the numbers correspond.
Try to answer these questions before determining the answer with the simulation. We suggest that you write down the reasons for your answers.
- As \(x_D\) increases, what happens to the optimal feed location?
- How does increasing the feed quality change the number of stages necessary to achieve the desired separation and the optimal feed location?
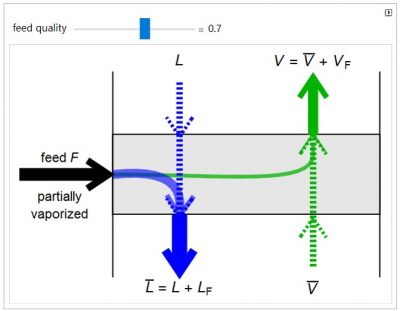
The flow rates to and from a feed stage of a distillation column are proportional to the thickness of the arrows in the figure. Liquid (blue) flows down the column and vapor (green) flows up. Use the slider to change the quality of the feed stream. A quality of 0 corresponds to a vapor feed (\(V_F\)) at its dew point and a quality of 1 corresponds to a liquid feed (\(L_F\)) at its bubble point; the state of the feed is indicated just below the feed arrow. Depending on its quality, the feed can go into the liquid flow or vapor flow, or it can be distributed between the two.
Try to answer these questions before determining the answer with the simulation. We suggest that you write down the reasons for your answers.
- As the feed quality increases, what will happen to the amount of feed that goes downward from the feed stage, and why?
- What should the feed quality be in order to have all of the feed go upward from the feed stage?
This Demonstration shows how to determine the number of equilibrium stages needed for a two-component (methanol/water) separation in a counter-current distillation column. It also shows the optimal location to feed the binary mixture into the column. Check “view process flow diagram” to show the x-y diagram on the left and the process flow diagram on the right. When that box is not checked, a larger – diagram is shown and you can move the cursor over the curves to see labels. The column feed has a methanol mole fraction of \(z_F\) = 0.5 and a quality of 0.5. The condenser is a total condenser, so it is not considered an equilibrium stage. Set the external reflux ratio L/D, as well as the methanol mole fractions in the distillate \(x_d\) and bottoms streams \(x_b\), with sliders. The number of stages is determined by stepping off stages starting at \(x_d\); the partial reboiler is an equilibrium stage. The number of equilibrium stages depends on the compositions of the exiting streams and the reflux ratio. The stages can be numbered with the first stage above the reboiler (bottom to top) or with the first stage at the condenser, use buttons to switch between these numbering options. Note that the \(x_b\) determined by stepping off stages is often lower than the desired \(x_b\) because reaching the exact value of the desired \(x_b\) would require a partial stage, which is not possible.
Try to answer these questions before determining the answer with the simulation. We suggest that you write down the reasons for your answers.
- As the external reflux ratio L/D increases, what happens to the number of stages needed to reach a constant \(x_b\) and why?
- As \(x_d\) increases, what happens to the number of stages needed to reach a constant \(x_b\) and why?
- As \(x_b\) decreases, what happens to the total distillate flow rate and why?


