Solid-Solid-Liquid Phase Diagrams: Example Problems
Try to solve these problems before watching the solutions in the screencasts.
Example Problem 1
Determine the mole fraction in equilibrium of the liquid in the liquid-solid Si phase at the point shown on the graph.
overall composition, zSi =0.70, xSi in liquid = 0.62, xSi in solid = 1.0
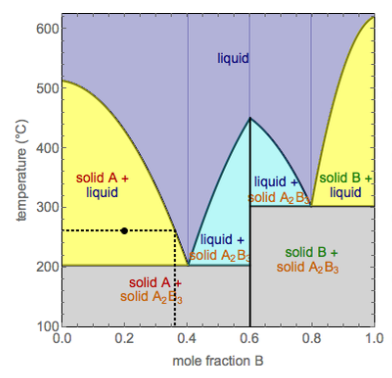
Example Problem 2
One mole of a solid at 140ºC, with an overall mole fraction of component B of 0.70, is heated until 0.40 moles of liquid forms. Use the temperature-mole fraction phase diagram below to determine the phases present, their composition, and their temperature.