Azeotropes: Interactive Simulations
These simulations were prepared using Mathematica. Download the free Wolfram player, and then download the simulation CDF file (link given below or click on figure to download). Screencasts below describe how to use the simulations.
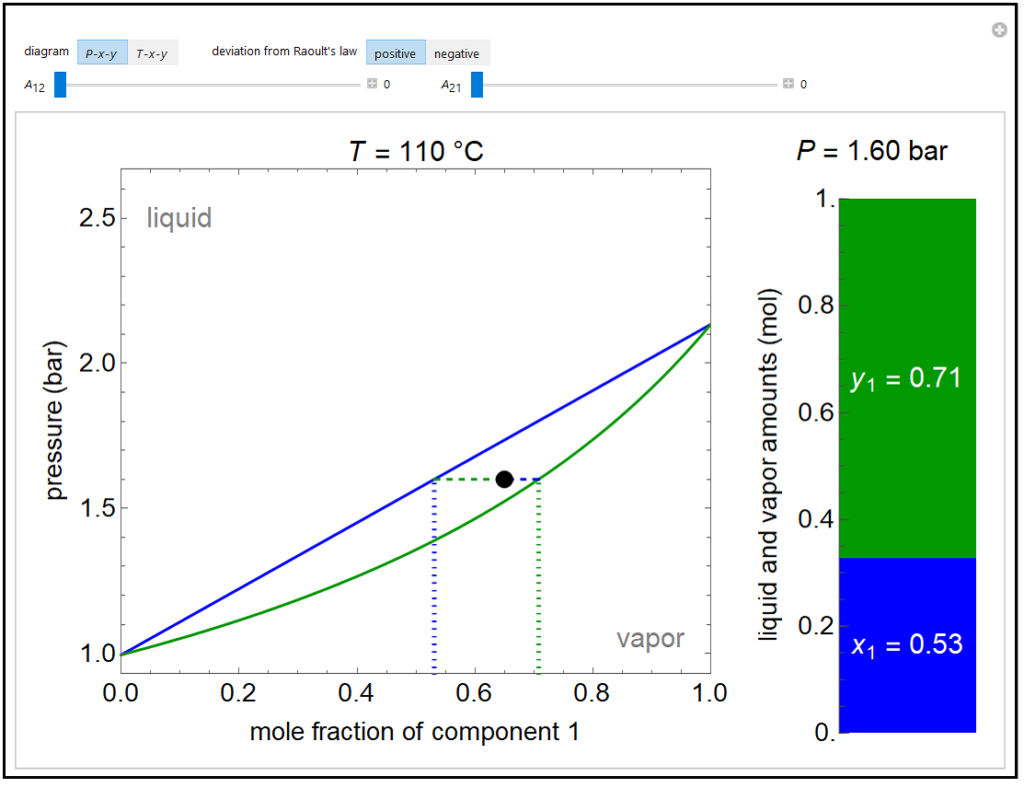
A P-x-y diagram at 110°C and a T-x-y diagram at 1200 mm Hg are generated for one mole of a binary mixture in vapor-liquid equilibrium (VLE). The solid blue curve represents the liquid-phase boundary (bubble point) and the solid green curve represents the vapor-phase boundary (dew point). The bar chart displays the amounts (moles) of liquid (blue) and vapor (green) in equilibrium and the mole fraction of component 1 in each phase (x1 for liquid, y1 for vapor); the relative amounts are calculated using the lever rule. Drag the black dot to change the mole fraction of component 1 and the temperature (on T-x-y diagram) or pressure (on P-x-y diagram). The activity coefficients for the non-ideal liquid mixture are calculated using the two-parameter Margules model; the parameters (A12 and A21) are changed with sliders. Negative deviations from Raoult’s law means the attractive interactions between components 1 and 2 are stronger than the average of the pure-component interactions. Positive deviations from Raoult’s law means the attractive interactions between components 1 and 2 are weaker than the average of the pure-component interactions. When the Margules parameters are zero, the liquid is ideal (Raoult’s law) and the activity coefficients are 1. When the activity coefficients deviate significantly from one, the system has an azeotrope.
Try to answer these questions before determining the answer with the simulation. We suggest that you write down the reasons for your answers.
- If the two parameters in the Margules equations (A12, A21) are positive and large, what behavior is likely to be seen for a pressure-mole fraction plot?
- If the two parameters in the Margules equations (A12, A21) are negative and large, what behavior is likely to be seen for a temperature-mole fraction plot?
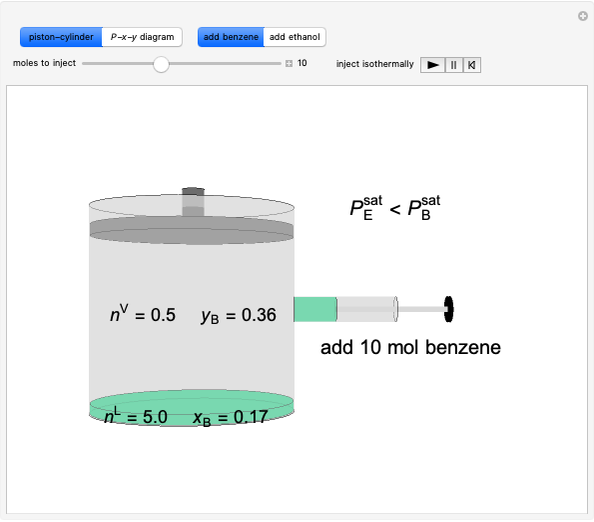
Benzene and ethanol, which have an azeotrope at a benzene mole fraction of xB=0.6, are in vapor-liquid equilibrium (VLE) inside a cylinder fitted with a piston. Add either benzene or ethanol to the system by clicking the play button next to “inject isothermally”. The final state when the system returns to equilibrium after injection depends on which component is injected and how much is injected. The piston-cylinder shows the relative amounts of liquid and vapor, and the total moles in the liquid phase, nL, and in the vapor phase, nV, are displayed. The mole fraction of benzene in the liquid, xB, and the vapor, yB are also displayed. The P-x-y diagram shows the results of the mass balances and demonstrates why a given phase is the final state. To observe behavior for injecting a different number of moles or to inject the other component, click reset before clicking “inject isothermally” again.
Try to answer these questions before determining the answer with the simulation. We suggest that you write down the reasons for your answers.
Benzene and ethanol form a maximum pressure azeotrope. Initially a piston-cylinder contains liquid (5 mol, xB = 0.17) and vapor 0.5 mol, (yB = 0.36) in equilibrium.
- If 0.5 mol of benzene were added at constant temperature and pressure, what is the final state likely to be?
- If 5.0 mol of benzene were added at constant temperature and pressure, what is the final state likely to be?
- If 5.0 mol of ethanol were added at constant temperature and pressure, what is the final state likely to be?