Enzyme Kinetics: Interactive Simulations and Excel Spreadsheets
The first simulation runs in your browser. The second simulation was prepared using Mathematica. Download the free Wolfram player, and then download the simulation CDF file (link given below or click on figure to download). You can download the excel spreadsheets and watch the screencasts that help you use them.
Enzyme Inhibition Kinetics
Try to answer these questions before determining the answer with the simulation. We suggest that you write down the reasons for your answers.
- For competitive inhibition in the Lineweaver-Burke equation, how is the y-intercept affected by an increase in inhibitor concentration?
- For the uncompetitive inhibition Lineweaver-Burke equation, how is the y-intercept affected by an increase in inhibitor concentration?
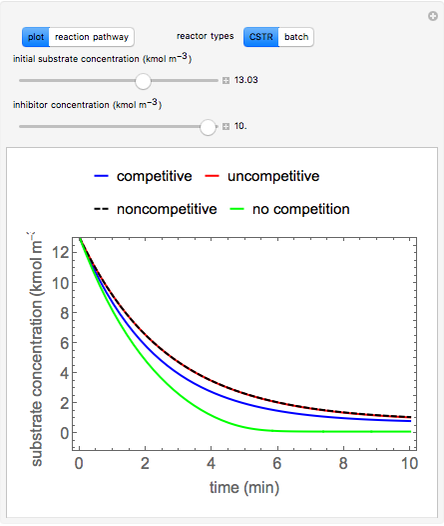
Inhibitors decrease the rates that enzymes bind to substrates and convert them to products. Three types of inhibition (competitive, uncompetitive, noncompetitive/mixed) and reaction with no inhibitor are compared for an enzyme reaction that obeys Michaelis-Menten kinetics. Substrate concentration is plotted versus time for a continuous stirred-tank reactor (CSTR) and for a batch reactor. Change the “inhibitor concentration”, which remains constant during reaction, with a slider. Change the “initial substrate concentration” for the batch reactor or the “feed substrate concentration” for the CSTR with a slider. Select “reaction pathway” to see the reaction steps, pathways, and a brief description of the type of inhibition. In competitive inhibition, the inhibitor attacks the enzyme to form an enzyme-inhibitor complex (E-I). In uncompetitive inhibition, the inhibitor attacks the enzyme-substrate complex (E-S). In noncompetitive inhibition, the inhibitor attacks the enzyme to form an enzyme-inhibitor complex (E-I) or it attacks the enzyme-substrate complex (E-S) to form an enzyme-substrate-inhibitor complex (E-S-I).
Try to answer these questions before determining the answer with the simulation. We suggest that you write down the reasons for your answers.
- Is the substrate concentration impacted greatly or slightly as the inhibitor concentration increases in a CSTR?
- Is the substrate concentration impacted greatly or slightly as the inhibitor concentration increases in a batch reactor?