Solid-Solid-Liquid Equilibrium


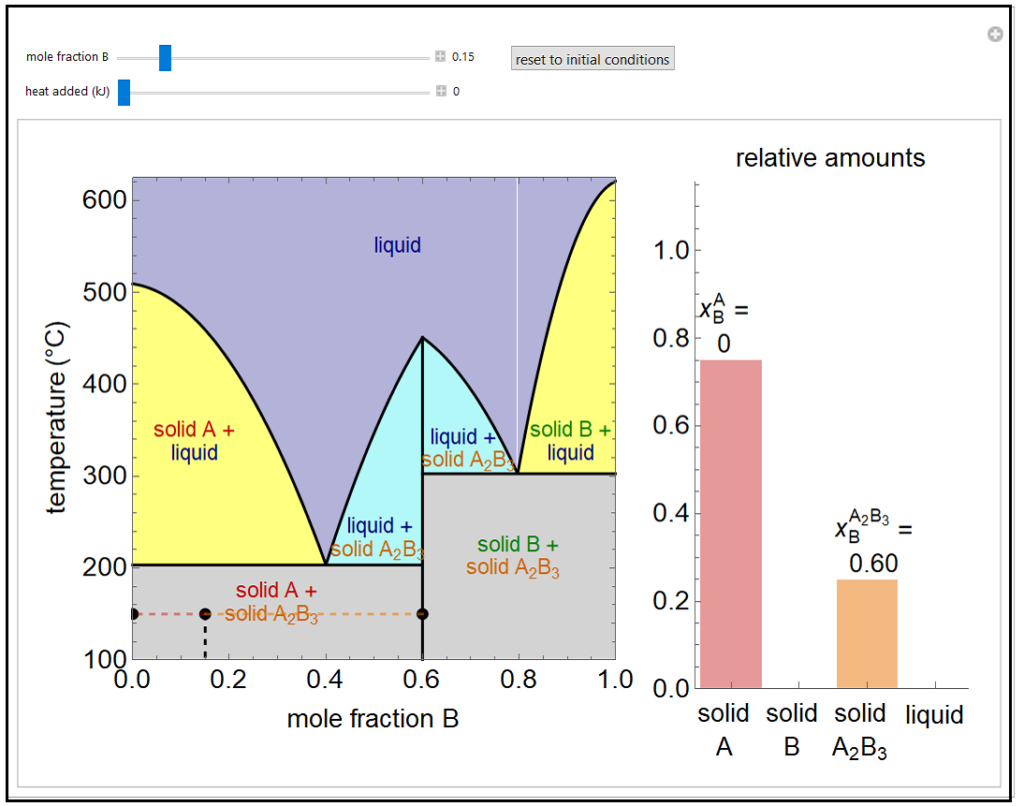
This simulation shows a solid-liquid phase diagram for two elements (A and B) that also form a solid compound (A2B3). Mixtures of the pure solids (A + A2B3 and B + A2B3) are immiscible. The amounts of each phase (solid A, solid B, compound A2B3, and a liquid phase containing A and B) are shown in the bar graph on the right. The mole fraction of B in the liquid phase (mixture of A and B) is given above the liquid bar in the bar graph. Move the black point by adjusting the sliders for mole fraction B and heat added. When heat is added, the temperature increases, except when the point is on one of the two horizontal lines (at about 200oC and 300oC) or when pure A2B3 is in equilibrium with the liquid phase. On the lines at 200oC and 300oC, three phases can be in equilibrium: solid A2B3, liquid, and either solid A or B. The relative amounts of each phase are obtained by a mole balance. The amount of heat added is not meant to represent a real system. In the two-phase regions, the relative amounts of each phase are obtained using the lever rule, and the mole fraction of B in the liquid phase is shown by a vertical dashed line.
This simulation runs on desktop using the free Wolfram Player. Download the Wolfram Player here.
About:
This simulation was made at the University of Colorado Boulder, Department of Chemical and Biological Engineering. Author: Megan E. Maguire
View the source code for this simulation


