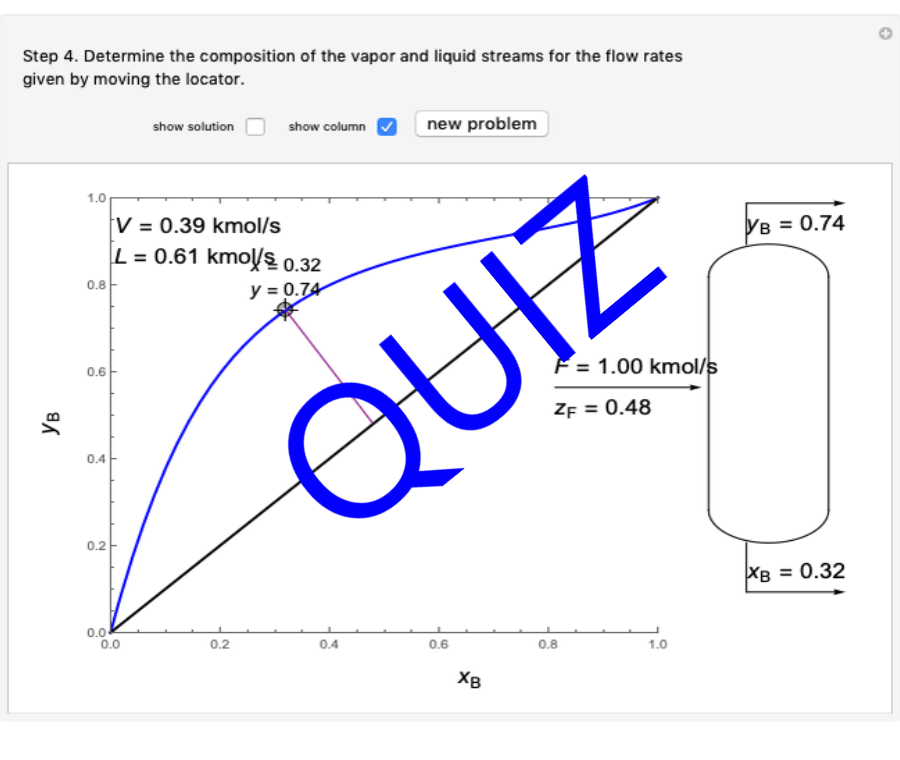
This simulation leads you through a step-by-step procedure to generate an x-y graph for a binary vapor-liquid equilibrium and then determines outlet compositions for a flash distillation column. Points are moved using a locator on the graph or moving the slider to select the desired quality (defined here as vapor flow rate divided by feed flow rate). After each solution is ready, select “show solution” to see the correct solution and then select “next step”. Selecting “show column” presents a representation of the column with flow rates and mole fractions (when “show solution” is selected). At any time, “new problem” can be clicked to generate a new set of values.