Aliasing (Sound)


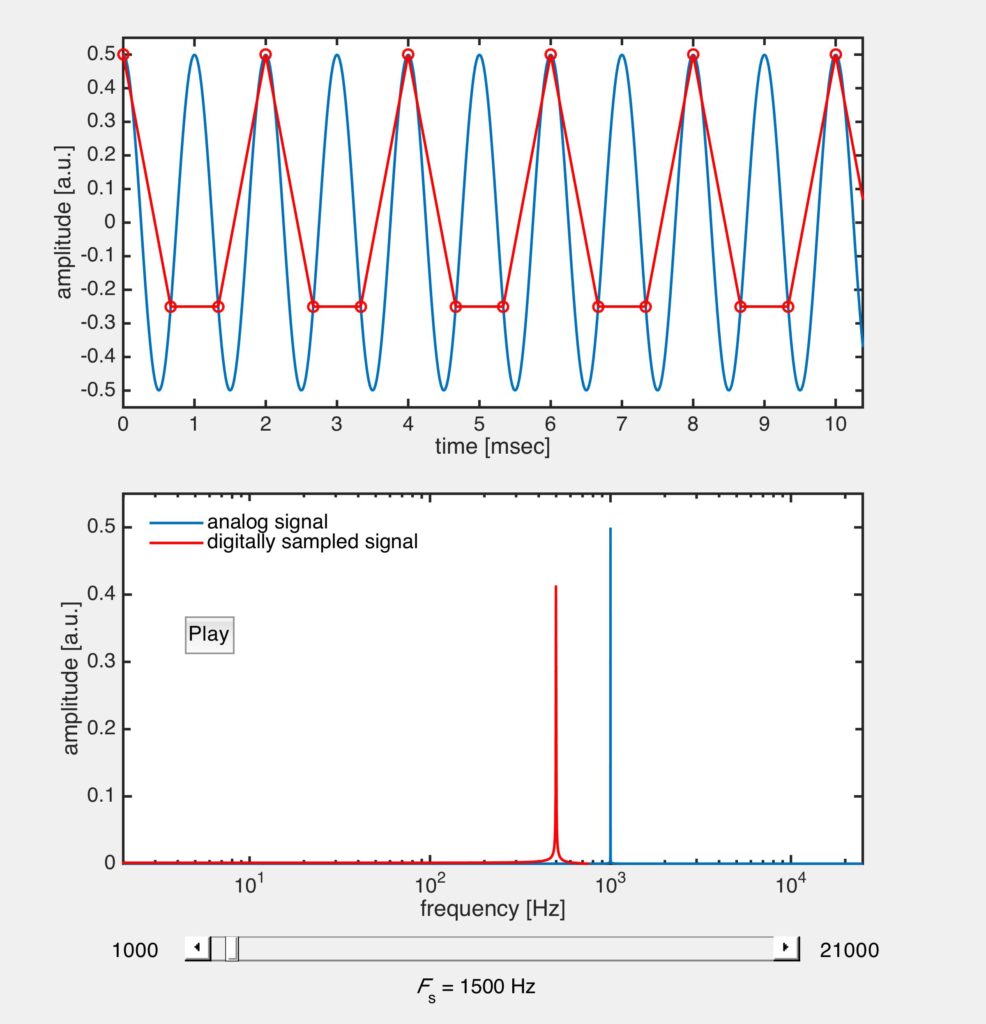
This MATLAB simulation illustrates aliasing of a wave visually and aurally. An “analog” signal is created at frequency f = 1000 Hz and is “digitally sampled” at a sampling frequency Fs. The analog (solid blue lines) and digital (red lines) signals are shown in the time domain (top plot) and the frequency domain (bottom plot). Control Fs with the slider bar and observe the change in the digital signal in both the time and frequency domains. If Fs >> f, the digital signal is an excellent representation of the analog signal. The Nyquist frequency is achieved when Fs = 2f and as Fs decreases below 2f, aliasing occurs. Aliasing is most apparent in the frequency domain plot (shift in the location of the spike), but can also be heard by pressing the “Play” button. Doing so will play the two signals (first the analog signal, a slight pause, then the digital signal). If aliasing is happening two different tones will clearly be heard.
This simulation requires MATLAB.
About:
This simulation was made at the University of Colorado Boulder, Department of Chemical and Biological Engineering. Author: Keith Regner


