Central Limit Theorem


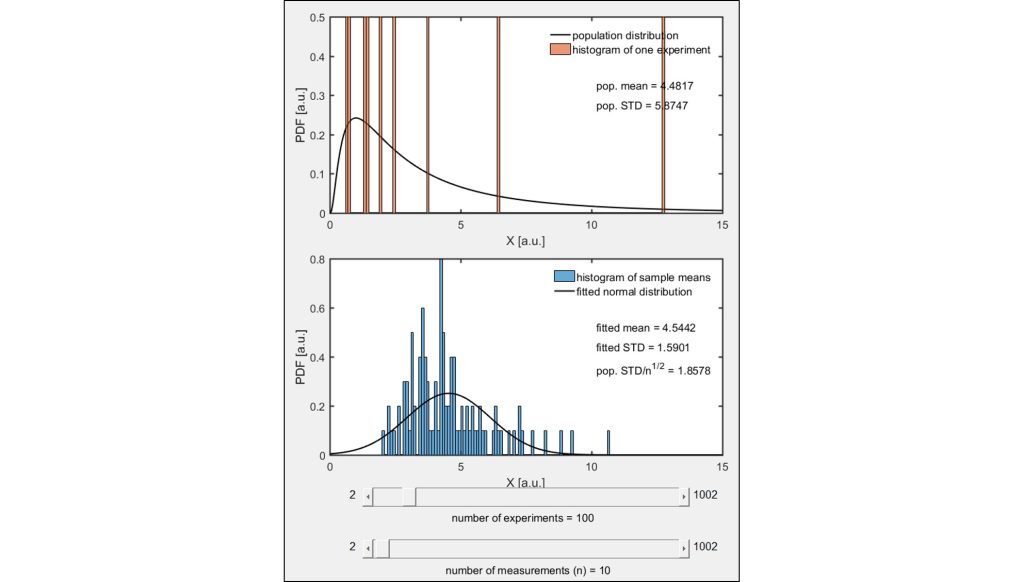
Consider an experiment where n measurements are drawn from a non-normal population. The measurements from this representative experiment are visualized in a normalized histogram as shown in the top plot. The population from which these measurements were drawn (solid black line) and the mean and standard deviation of this population distribution are also shown in the top plot. This experiment is repeated N times and the mean of the n measurements from each of the N experiments are visualized in a normalized histogram shown in the bottom plot. These data are then fit with a normal distribution (solid black line) and the mean and standard deviation of the resulting fitted normal distribution are indicated.
According to the Central Limit Theorem, the measurement means from each experiment should follow a normal distribution with a mean equal to the mean of the population distribution and standard deviation equal to the population standard deviation over if n 30. A comparison of the population mean and standard deviation (indicated on the top plot) and the fitted mean and fitted standard deviation multiplied with (indicated on the bottom plot) shows this fact to be quite accurate if n 30. Change the number of experiments N and the number of measurements in each experiment n with the slider bars.
This simulation requires MATLAB.
About:
This simulation was made at the University of Colorado Boulder, Department of Mechanical Engineering. Author: Keith Regner


