Finding Probabilities for Intervals of a Normal Distribution
Description
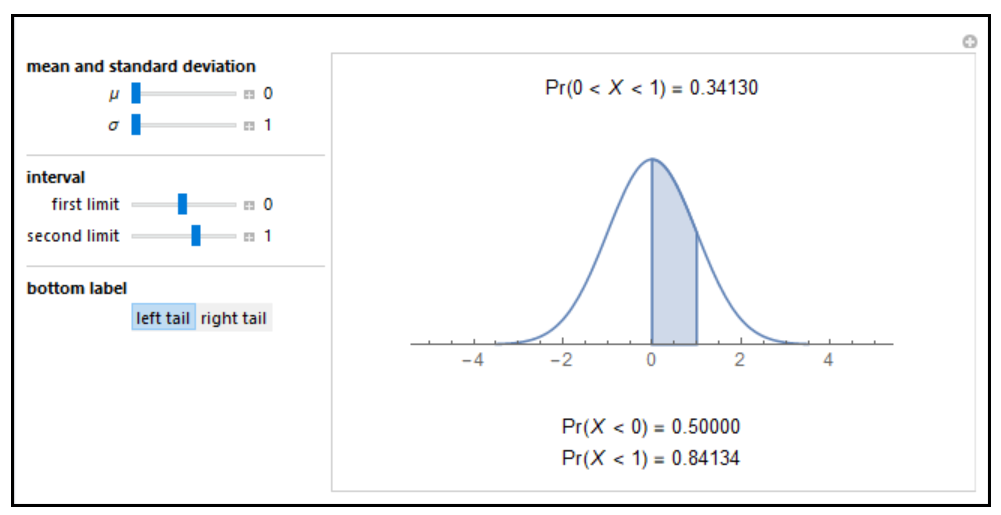
This simulation computes the probability of any interval for a normal distribution. Input the mean and standard deviation (parameters μ and σ) and use the sliders to set the two bounds of the interval. The output shows a plot of the area lying below the probability density function and enclosed by the limits, and the value of this probability above the plot. At the bottom you can see the left or right tail probabilities.