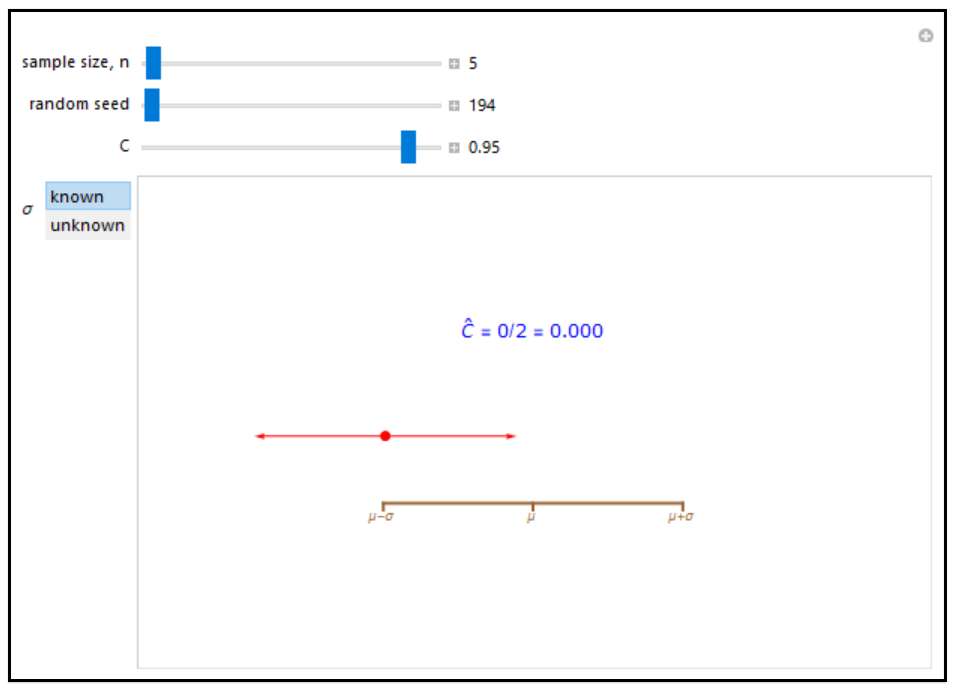
This simulation shows the confidence interval, \( \bar{x} \pm m \), for \( μ \) based on random samples of size \( n \) from a normal population with mean \( μ \) and standard deviation \( \sigma \), where \( \bar{x} \) is the sample mean and \( m \) is the margin of error for a level \( C \) interval. There are two cases, corresponding to when \( \sigma \) is assumed known, or is not known and is estimated by the standard deviation in the sample. For the known \( \sigma \) case, \( m = \sigma z^{*} / \sqrt{n} \), where the critical value \( z^{*} \) is determined so that the area to the right of \( z^{*} \) is \( (1 – C) / 2 \). Similarly in the unknown \( \sigma \) case, \( m = t^{*} s / \sqrt{n} \), where \( s \) is the sample standard deviation and \( t^{*} \) is the critical value determined from a t-distribution with \( ( n – 1) \) degrees of freedom.