Simple Linear Regression


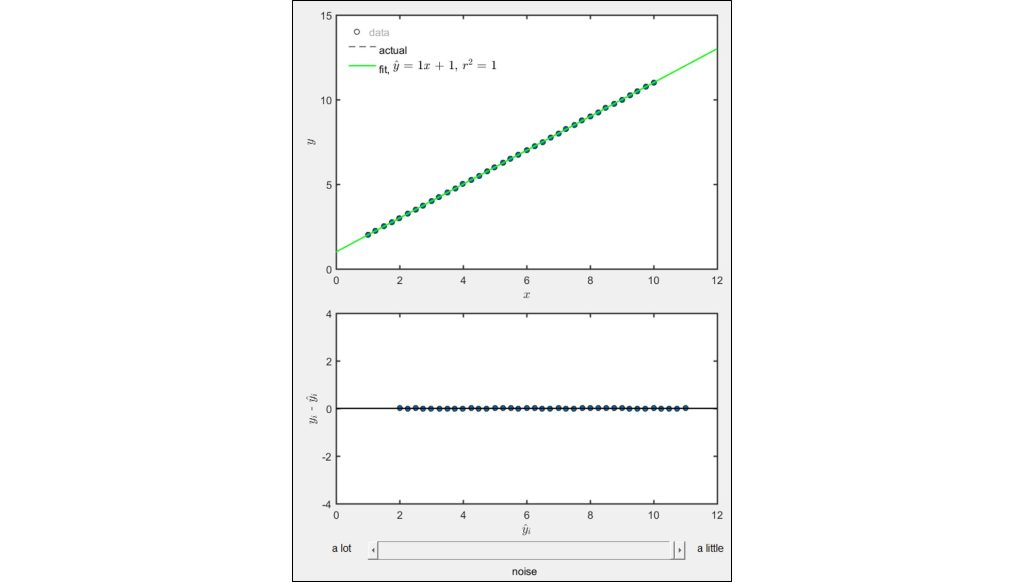
This MATLAB simulation shows the affect of noise and outliers in linear regression. The line y = x + 1 is shown in the top plot (dashed black line). Experimental data are generated from this equation by adding white Gaussian noise and are shown on the same plot (blue circles). These data are fit with a linear model (solid green line). The residuals of that fitting are shown in the lower plot. Change the amount of “noise” in the data using the slider bar and observe the change in the equation of best fit, the r2 value, and the residuals plot. To add an outlier, press the space bar and select any location on the top plot to add the point. The point will replace the middle point of the original data set. The fit to the original data and the data with the outlier will both be shown in the upper plot. The residuals of the original and new fits are shown in the lower plot. Observe the change in change in the equation of best fit, the r2 value, and the residuals plot.
This simulation requires MATLAB.
About:
This simulation was made at the University of Colorado Boulder, Department of Mechanical Engineering. Author: Keith Regner


