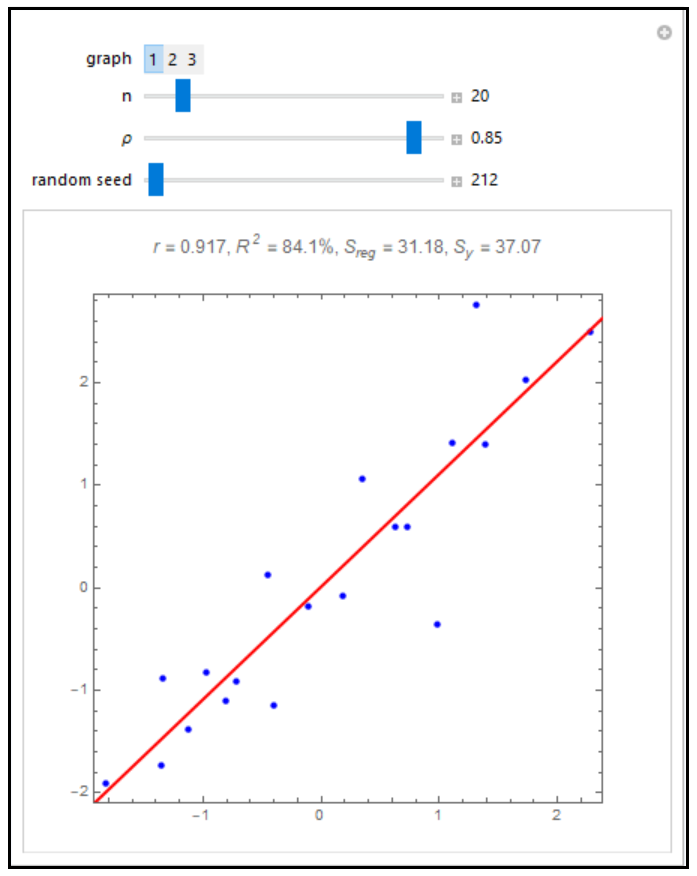
In general, R2 is often referred to as the coefficient of determination and its verbal interpretation is that it is the fraction of variation explained by the model. This is illustrated in the case of simple linear regression. A random sample of size n is generated from a bivariate normal distribution with correlation parameter p, means 0, and variances 1. Graph 1 shows the data and the fitted regression line. Graph 2 shows the data and the fitted points. In graph 3, a rug is added on each of the y-axes. The axes on the left with the blue rug show the y values; the axes on the right with the red rug show the fitted y values. The plot label shows R2 = r2 = Sreg/Sy, where r is the correlation coefficient, Sy is the sum of the squared deviations of the y from their mean, and Sreg is the sum of the squared deviations of the \( \hat{ y } \) from their mean. In graph 3, the rugs provide a visualization of the spread of the \( y \) and \( \hat{ y } \). In statistics courses, it is often mentioned that R2 = r2 and that r2 is the fraction of variation explained by the model. Notice how the plot changes dramatically as the parameter p is changed.