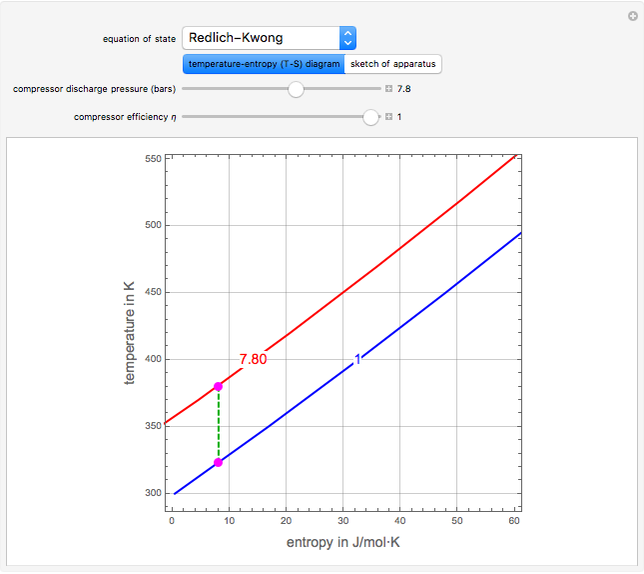
In this simulation, n-butane is compressed adiabatically from 1 bar and 50°C to user-set values for the discharge stream pressure and the compressor efficiency η. Click the “sketch of apparatus” button to determine the outlet stream temperature (expressed in °C) and the power consumed (expressed in kW). The inlet molar flow rate of n-butane supplied to the compressor is ṅ = 1 kmol/s. You can select from one of three cubic equations of state (Redlich–Kwong, Soave–Redlich–Kwong (SRK), or Peng–Robinson). An ideal gas at 1 bar and 298.15 K is taken as the reference state for computing the enthalpy H and entropy S for the system flow streams. In the temperature-entropy (T-S) diagram, the blue curve denotes the inlet stream isobar (P = 1 bar) and the red curve the discharge stream isobar. A limiting compression transformation on the T-S diagram is shown in dashed green. You can clearly see the difference between the ideal case (shown by a vertical dashed green line), when the compressor is isentropic (i.e., η = 100%), and a more realistic case, where the efficiency is less than 100% (shown by a tilted dashed green line).