Compare Clausius-Clapeyron and Antoine Equations


Description
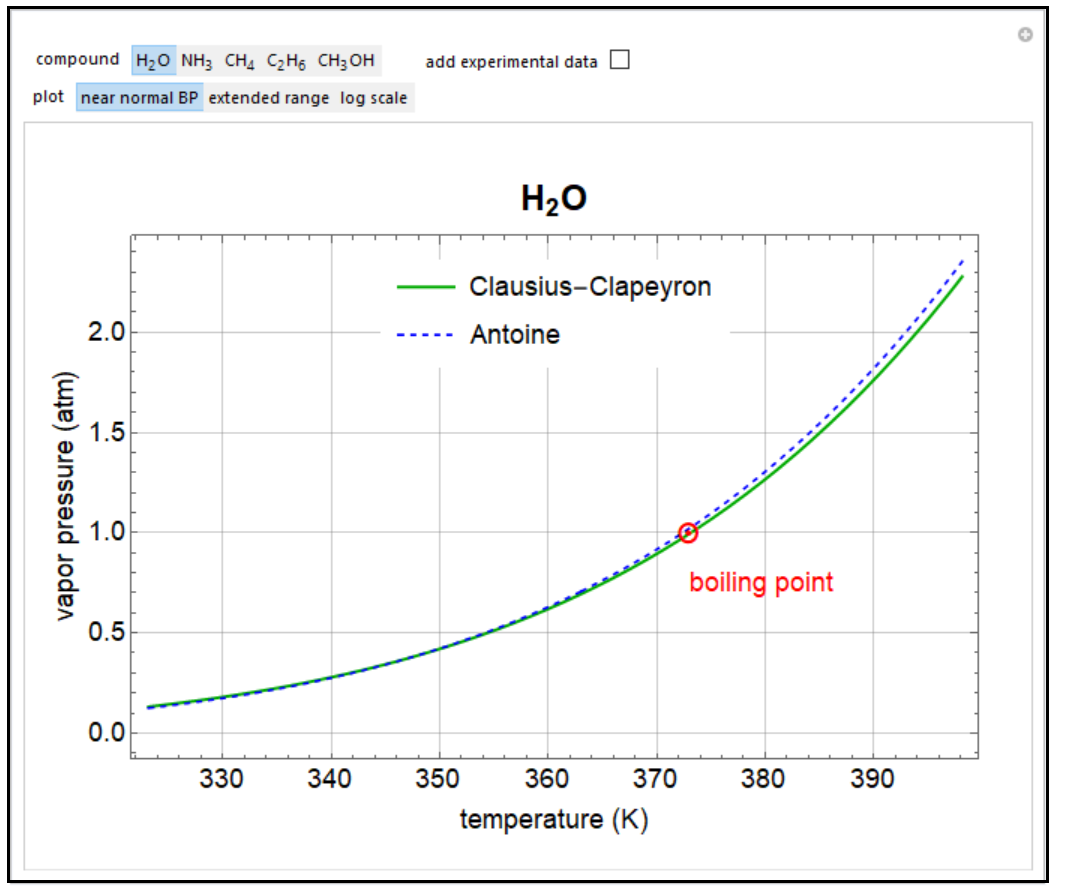
This simulation plots the saturation pressure versus temperature predicted by the Clausius-Clapeyron equation for five molecules. The Antoine equation, which is obtained by a fit to experimental data, is also plotted. For water, click “add experimental data” to display data points. The plots of vapor pressure versus temperature are shown over a narrow temperature range near the boiling point at 1-atm pressure (click “near boiling point”) or over a range from the triple point to the critical point (click “extended range”). When log scale is selected, the log of the saturation pressure is plotted versus the inverse temperature.
This simulation runs on desktop using the free Wolfram Player. Download the Wolfram Player here.
About
Author: S. M. Blinder. Open content licensed under CC BY-NC-SA.
View the source code for this simulation.


