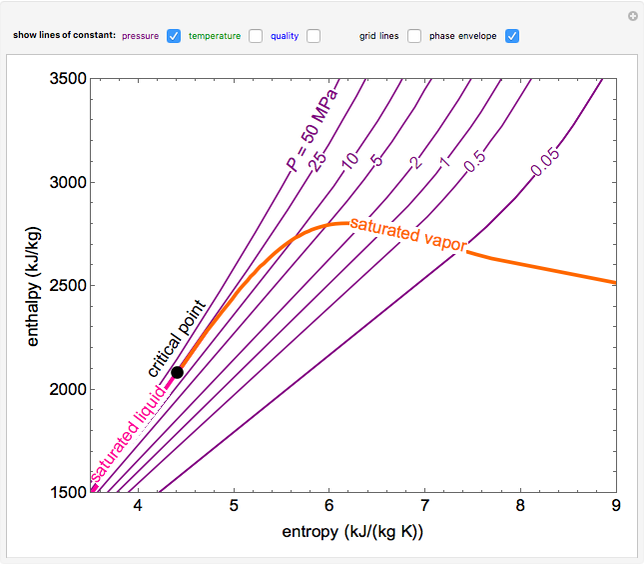
This simulation shows an enthalpy-entropy (H-S) diagram for water. Use the checkboxes to display lines of constant pressure P (purple), temperature T (green) or vapor quality q (blue). Check “phase envelope” to show saturated liquid (magenta), saturated vapor (orange line) and the critical point (black dot). You can also show the grid lines.
Download this simulation
This simulation runs on desktop using the free Wolfram Player. Download the Wolfram Player here.
About:
This simulation was made at the University of Colorado Boulder, Department of Chemical and Biological Engineering. Author: Rachael L. Baumann
View the source code for this simulation