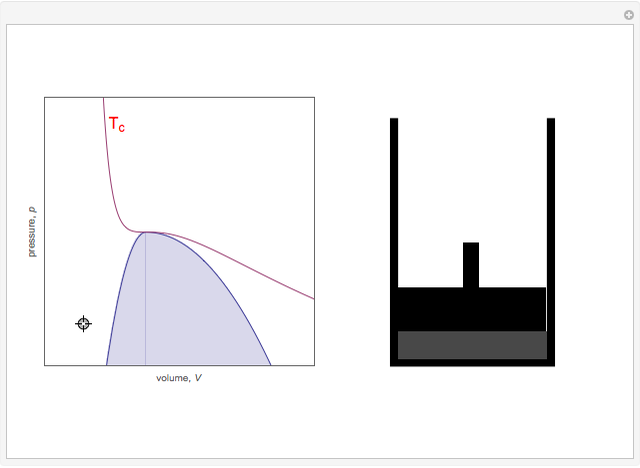
On the left is a phase diagram of the critical region of a representative fluid. Within the shaded area, the fluid separates into two phases: liquid and gas. The critical isotherm is also shown, labeled by the critical temperature Tc. At the critical point, this isotherm is tangent to the two-phase region. A gas can be liquefied only after it is cooled below its critical temperature. Drag the locator to vary the pressure and volume of the fluid within the cylinder shown on the right. Within the shaded region, you will see separation into liquid and gaseous phases. The density of a fluid is indicated by its gray-level intensity. Within the two-phase region, the properties of the two phases merge as the critical point is approached.