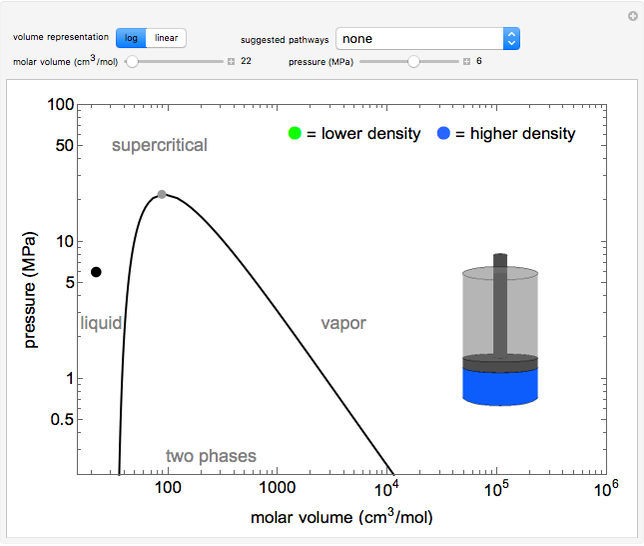
Phase Behavior on a Pressure-Volume Diagram


This log pressure versus log volume phase diagram illustrates phase behavior of a single component (water) and the concept of state functions. Use sliders to move the black dot at constant pressure or constant volume. The piston-cylinder represents the volumes of liquid and vapor present, use buttons to view the volumes on a log or linear scale. When two phases are present and the linear scale is selected, a pop-out shows a magnified view of the liquid and vapor volumes. Liquid in the cylinder is blue and vapor is green, and the intensities of these colors increase as their densities increase. Note that the single-phase liquid, vapor, and supercritical regions are labeled, but no boundaries exist between them. The critical point, which is the highest temperature and pressure where two phases coexist, is at 647 K and 22.1 MPa for water. Use this diagram to illustrate circumnavigating the critical point by moving the black dot from the liquid phase to the supercritical region and then to the vapor phase without a phase change (i.e., without two phases coexisting). By contrast, observe two phases in equilibrium by moving the dot from a small to large volume below the critical pressure.
This simulation runs on desktop using the free Wolfram Player. Download the Wolfram Player here.
About:
This simulation was made at the University of Colorado Boulder, Department of Chemical and Biological Engineering. Author: Rachael L. Baumann
View the source code for this simulation


