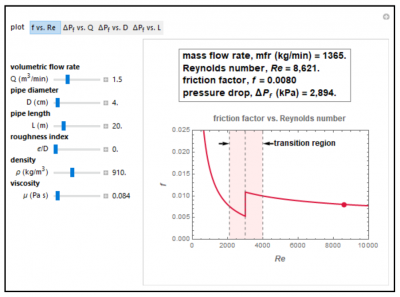
Calculating the Pressure Drop and Power in Pipe Flow: Interactive Simulation
This simulation was prepared using Mathematica. Download the free Wolfram player, and then download the simulation CDF file (link given below or click on figure to download). Try to predict the behavior when a parameter changes before using a slider to change that parameter.
This Demonstration calculates and displays the pressure drop in a pipe due to friction as a function of the liquid’s volumetric flow rate, the pipe’s diameter, length, and degree of roughness, and the liquid’s density and viscosity. It also calculates and displays the liquid’s mass flow rate, the Reynolds number, and the corresponding friction factor. You can choose one of the following plots to display: the friction factor versus Reynolds number (Moody diagram) or the pressure drop versus the flow rate, the pipe’s diameter, or its length.
This simulation was prepared by M. D. Normand and M. Peleg and is located here. Open content licensed under CC BY-NC-SA.
Try to answer these questions before determining the answer with the simulation. We suggest that you write down the reasons for your answers.
- As the diameter of a pipe decreases, what happens to the pressure drop?
- As the degree of roughness increases for pipes of equal diameter, what happens to the pressure drop?

