Gibbs Free Energy and Phase Separation: Interactive Simulations
These simulations were prepared using Mathematica. Download the free Wolfram player, and then download the simulation CDF file (link given below or click on figure to download). Try to predict the behavior when a parameter changes before using a slider to change that parameter. Screencasts below explain how to use these simulations.
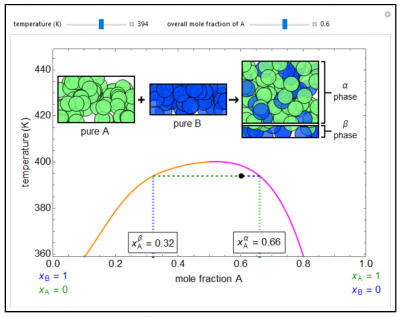
A temperature-composition diagram is shown for two liquids (A, B) that are only partially miscible within the region enclosed by the orange/purple curve. Each phase in the two-phase region contains both A and B; the α phase (represented by the purple line, mole fraction = \(x_A^\alpha\)) is enriched in A and the β phase (orange line, \(x_A^\beta\)) is enriched in B. Outside the phase envelope, A and B are completely miscible. Sliders for “temperature” and “overall mole fraction of A” move the black dot around the diagram. The sizes of the rectangles at the top for pure A and pure B are proportional to the overall mole fraction of that component. The size(s) of the container(s) on the right is/are proportional to the amounts of the phase(s) (either α and β or a single miscible phase) in equilibrium, and the mole fractions are represented by the relative numbers of green (A) and blue (B) circles.
Try to answer these questions before determining the answer with the simulation. We suggest that you write down the reasons for your answers.
- As the temperature increases for a binary liquid mixture that exhibits phase separation, do you expect the compositions of the two phases to be closer together or further apart? Why?
- Suppose a binary liquid mixture separates into two phases ( \(x_1^\alpha\) = 0.10, \(x_1^\beta\) = 0.79). If the liquid contains 6 moles of component 1 and 4 moles of component 2, is more liquid in the α phase or β phase? Why?
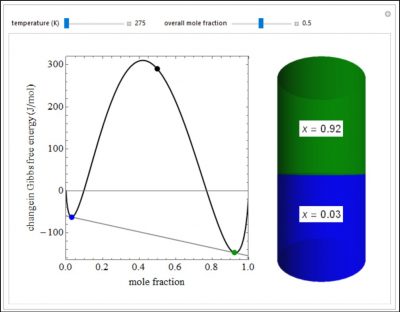
This Demonstration plots the change in Gibbs free energy versus mole fraction of one component in a non-ideal binary mixture. Two liquid phases form when the Gibbs free energy is lower for the two phases than for one phase. A line that is tangent to the Gibbs free energy curve at two points (blue and green points) represents the Gibbs free energy change over the mole fraction range between the two points. The mole fractions at the blue and green points are the mole fractions of the two phases, and these mole fractions are shown on the container on the right. The size of each phase on the right is proportional to the amount of that phase, and these amounts are obtained from a mass balance (lever rule).
Try to answer these questions before determining the answer with the simulation. We suggest that you write down the reasons for your answers.
- As the temperature increases, would you expect the Gibbs free energy change of a binary mixture be more or less negative? Why?
- For the figure below, how will the compositions of the two phases change as the overall mole fraction increases from 0.3 to 0.6? Explain why.


