Osmosis and Reverse Osmosis: Interactive Simulations and Digital Experiment
These simulations were prepared using Mathematica. Download the free Wolfram player, and then download the simulation CDF file (link given below or click on figure to download). Try to predict the behavior when a parameter changes before using a slider to change that parameter. A screencast below explains how to use the second simulation. The digital experiment will run in a browser.
This simulation was prepared by S. M. Blinder and is located here. Open content licensed under CC BY-NC-SA.
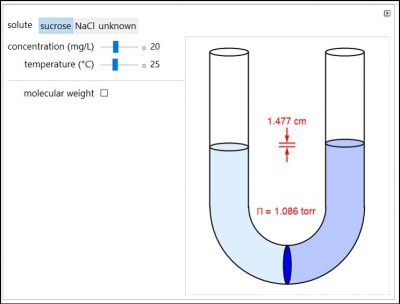
Osmosis involves the selective passage of certain components of a solution through a semipermeable membrane, with exclusion of other components. The membrane is permeable only to water, but impermeable to the solute in a water solution. The membrane, which is represented by a blue disk at the bottom of the U-tube, separates the pure solvent on the left from the solution on the right. Solvent will spontaneously flow through the membrane into the solution, in an attempt to equalize the concentrations on the two sides. This gives rise to an osmotic pressure. Note that for NaCl, the mole fraction used in the osmotic pressure equation is the mole fraction of ions, which is twice the mole fraction of NaCl. The other solutes in this simulation are undissociated. Osmotic measurements provide a sensitive method for determining molecular weights M, particularly for polymers. For a solute concentration of Cx g/L, the molar concentration [X] is equal to Cx/M.
Try to answer these questions before determining the answer with the simulation. We suggest that you write down the reasons for your answers.
- Will sucrose or NaCl have a larger osmotic pressure if they each have a concentration of 20 mg/L? Why?
- When the temperature increases, does the osmotic pressure increase, decrease, or not change? Why?
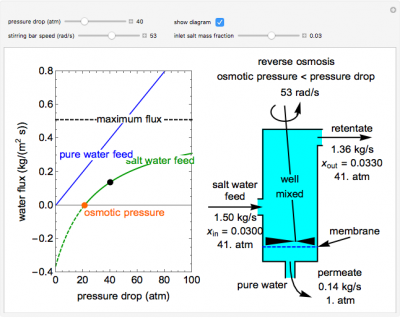
This Demonstration models a reverse osmosis process in which salt water at high pressure is fed to a chamber with a membrane that is only permeable to water. The outlet permeate stream is pure water at low pressure, and the retentate stream is water enriched in salt. Use the sliders to set the pressure drop across the membrane, the inlet salt mass fraction and the stirring bar speed. Increasing the stirring speed decreases concentration polarization on the feed side of the membrane and increases water flux through the membrane. The inlet mass flow rate is fixed and the process is isothermal. The water flux through the membrane is plotted versus the pressure drop across the membrane. The blue line represents the water flux when pure water is fed to the system. The green line represents the water flux when salt water is fed to the system. The dashed black line indicates the maximum water flux through the membrane. The values in the diagram on the right correspond to the conditions represented by the black dot, whose location is selected by the pressure drop slider. If the pressure drop is less than the osmotic pressure (orange dot on the x-axis), the system exhibits osmosis, and pure water permeates into the salt water feed.
Try to answer these questions before determining the answer with the simulation. We suggest that you write down the reasons for your answers.
- As the stirring bar speed increases for a reverse osmosis process, what happens to the flux through a reverse osmosis membrane? Why?
As the inlet salt mass fraction increases for a reverse osmosis process (while keeping pressure drop and stirring bar speed the same), does the permeate flow rate increase or decrease? Why?
A reverse osmosis (RO) membrane separates a saltwater solution into a permeate stream (purified water) and a retentate stream (higher salt concentration solution). Reverse osmosis uses a high pressure on the feed side (salt water) of a semi-permeable membrane to overcome the osmotic pressure. The experiment examines the effects of feed pressure and salt concentration on permeate flow rate and salt rejection. Reverse osmosis converts sea water to fresh water on a large scale.


