Steam Tables: Interactive Simulation
This simulation was prepared using Mathematica. Download the free Wolfram player, and then download the simulation CDF file (link given below or click on figure to download). Try to predict the behavior when a parameter changes before using a slider to change that parameter. For this simulation, a screencast is provided to explain how to use it.
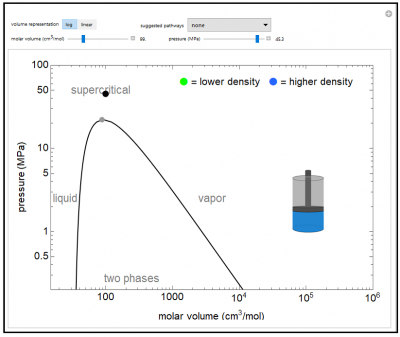
The pressure-volume phase diagram (pressure versus log of molar volume) is shown for water. This demonstrates typical phase behavior of a single component and illustrates the concept of state functions. Drag the black dot on the P-V plot to change pressure and volume (and temperature also changes). The piston-cylinder represents the log of the volume, so that the large differences in volume between vapor and liquid can be visualized. The fluid in the cylinder is blue when liquid, and the intensity of the color increases as the fluid becomes denser. As the fluid becomes more gas-like, the color changes to green, and the green color becomes less intense as density decreases
Try to answer these questions before determining the answer with the simulation. We suggest that you write down the reasons for your answers.
- How do the number of phases change as the molar volume increases at constant pressure?
- Is there a way to go from liquid to vapor without going through any phase boundaries?


