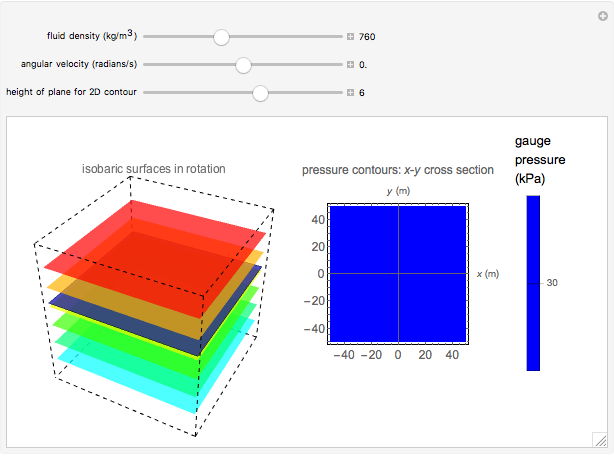
This simulation shows how the pressure in a fluid is affected by rotation at constant angular velocity. The graph on the left shows the isobaric surfaces (surfaces of constant pressure) that result from the rotation. The graph on the right shows pressure contours taken from cross-sections in the x-y plane of the graph on the left. The cross-section is represented by a blue plane in the 3D graph; a darker color indicates higher hydrostatic pressure. The pressure profile does not depend on the direction of the angular velocity. This physical simulation is closely analogous to Newton’s classic rotating bucket experiment.