Combined Free and Forced Convection


Description
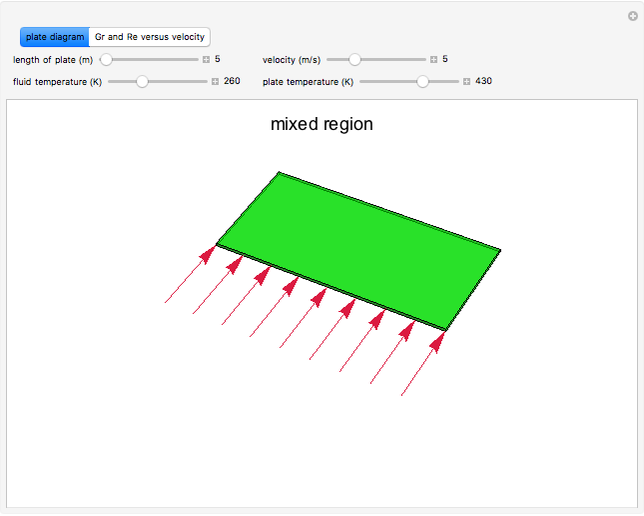
The Grashof number and the square of the Reynolds number are plotted as functions of the velocity of air as it passes over a flat plate. The yellow area represents the region where \( \mathrm{ Re }^{2} / \mathrm{ Gr } < 0.2 \) and free convection dominates heat transfer. The blue area represents the region where \( \mathrm{ Re }^{2} / \mathrm{ Gr } > 5 \) and forced convection dominates heat transfer. The dotted red line represents the velocity selected by the slider, and the Nusselt number \( \mathrm{ Nu } \) is displayed above the plot for that velocity. The plate diagram is a representation of the system. The plate temperature and the fluid temperature can be changed with sliders. The length of the plate can also be changed with sliders.
About
View the source code for this simulation


