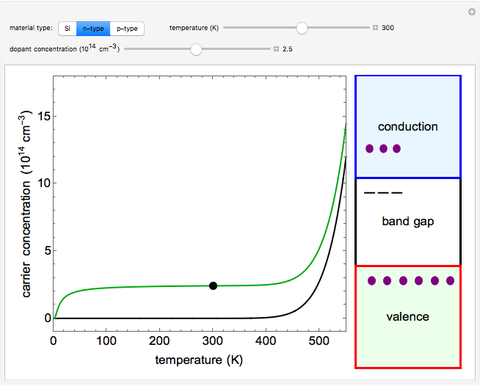
This simulation plots the charge carrier concentrations in silicon (Si) and doped Si (n- and p-types) as a function of temperature. The black curve is for undoped Si and the green curve for doped Si. The dopant concentration is selected with a slider. The corresponding electron band configuration on the right is at the temperature selected by the slider (and represented on the plot by the black dot). The number of solid purple dots is proportional to the electron concentration, and the number of open purple dots is proportional to the hole concentration. Phosphorous doping creates n-type Si, whereas boron doping creates p-type Si.