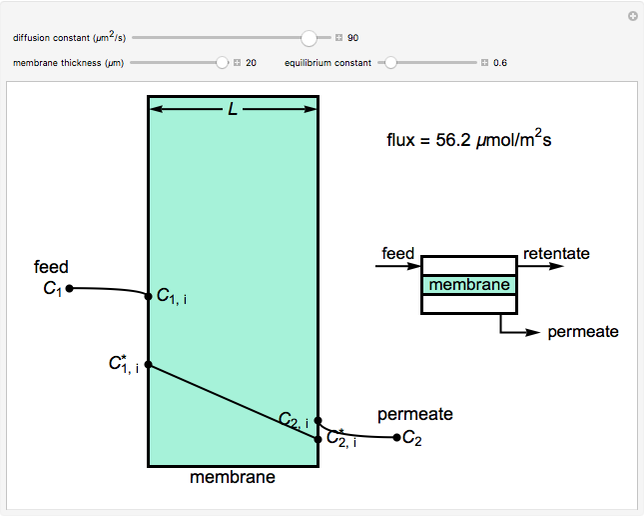
Membrane Concentration Profile


This simulation shows the concentration profiles on the feed and permeate sides of a membrane resulting from a diffusion boundary layer and the concentration profile inside the membrane. It also calculates the molar flux through the membrane. Use the sliders to change the membrane diffusion constant, the equilibrium constant and the membrane thickness. The feed concentration C1 and the desired permeate concentration C2 are set. Place your cursor over a black dot to see its concentration displayed on the right.
This simulation runs on desktop using the free Wolfram Player. Download the Wolfram Player here.
About:
This simulation was made at the University of Colorado Boulder, Department of Chemical and Biological Engineering. Author: Rachael L. Baumann
View the source code for this simulation


