Nonlinear Transformations


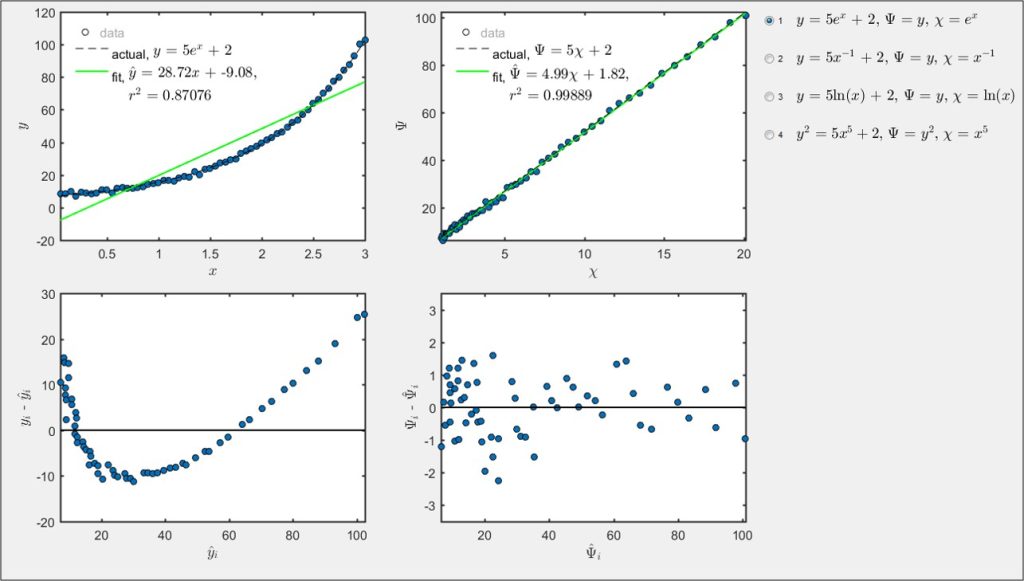
This MATLAB simulation shows how transformations can be used to manipulate nonlinear equations into a form for linear regression analysis. Four equations are shown on the right hand side of the window and can be selected with the radio buttons. The selected nonlinear equation is plotted in the upper left plot (dashed black line). Experimental data are generated from this equation by adding white Gaussian noise and are shown on the same plot (blue circles). These nonlinear experimental data are fit with a linear model (solid green line). The residuals of that fitting are shown in the lower left plot and exhibit a clear trend, indicating the linear approximation is violated. The nonlinear equation and experimental data are transformed accordingly and shown in the upper right plot. The transformed data are fit with a linear model. The residuals for the resulting fit are shown in the lower right plot.
This simulation requires MATLAB.
About:
This simulation was made at the University of Colorado Boulder, Department of Mechanical Engineering. Author: Keith Regner


