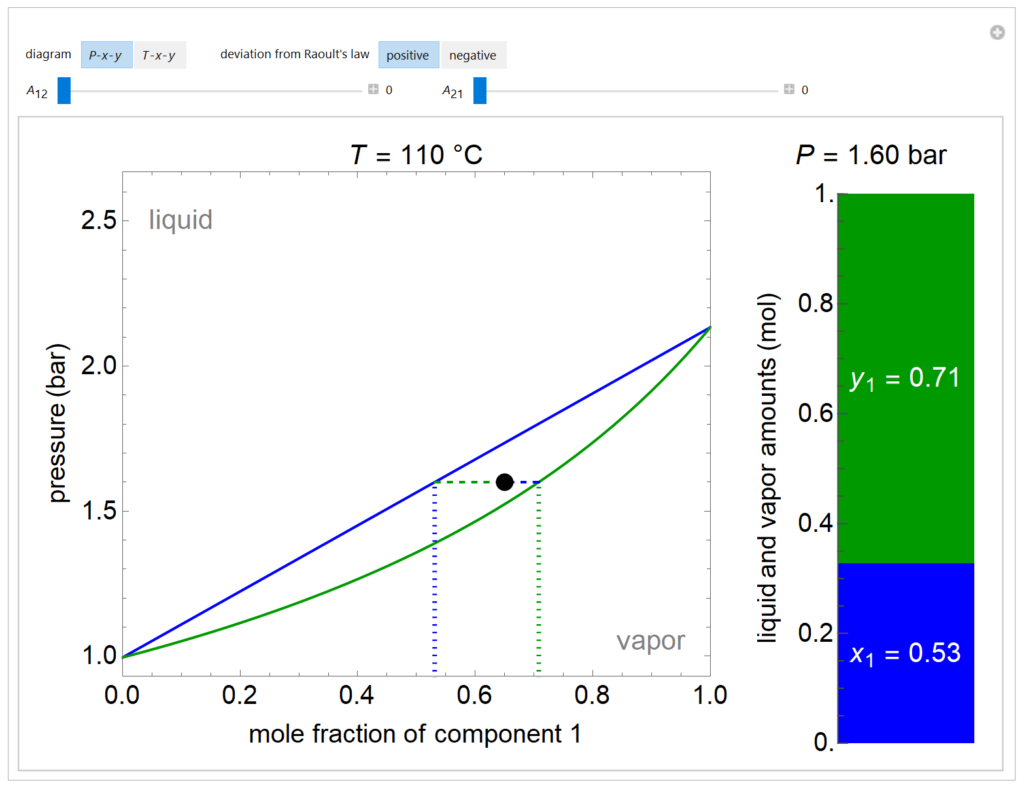
Non-Ideal Vapor-Liquid Equilibrium Modeled by the Margules Equation


A P-x-y diagram at 110°C and a T-x-y diagram at 1200 mm Hg are generated for one mole of a binary mixture in vapor-liquid equilibrium (VLE). The solid blue curve represents the liquid-phase boundary (bubble point) and the solid green curve represents the vapor-phase boundary (dew point). The bar chart displays the amounts (moles) of liquid (blue) and vapor (green) in equilibrium and the mole fraction of component 1 in each phase (x1 for liquid, y1 for vapor); the relative amounts are calculated using the lever rule. Drag the black dot to change the mole fraction of component 1 and the temperature (on T-x-y diagram) or pressure (on P-x-y diagram). The activity coefficients for the non-ideal liquid mixture are calculated using the two-parameter Margules model; the parameters (A12 and A21) are changed with sliders. Negative deviations from Raoult’s law means the attractive interactions between components 1 and 2 are stronger than the average of the pure-component interactions. Positive deviations from Raoult’s law means the attractive interactions between components 1 and 2 are weaker than the average of the pure-component interactions. When the Margules parameters are zero, the liquid is ideal (Raoult’s law) and the activity coefficients are 1. When the activity coefficients deviate significantly from one, the system has an azeotrope.
This simulation runs on desktop using the free Wolfram Player. Download the Wolfram Player here.
About:
This simulation was made at the University of Colorado Boulder, Department of Chemical and Biological Engineering. Author: Rachael L. Baumann
View the source code for this simulation


