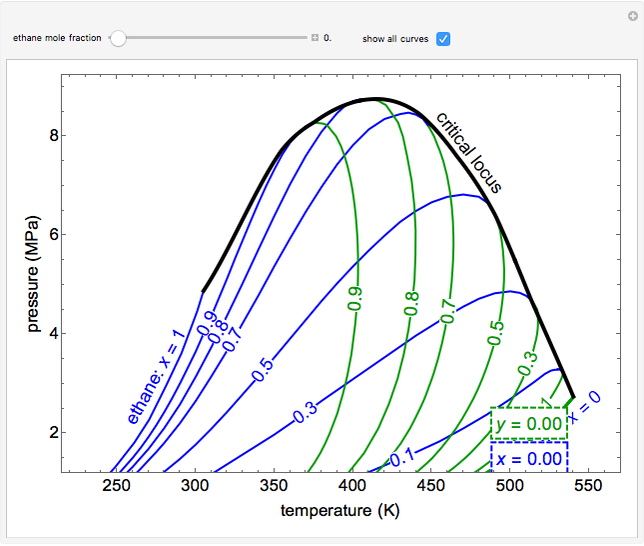
Pressure-Temperature Diagram for Binary Mixture


This simulation shows a pressure-temperature (P-T) diagram for an ethane/heptane mixture in vapor-liquid equilibrium. The single-component plots of saturation pressure as a function of temperature are shown, as are P-T curves at six ethane mole fractions; the liquid curve is shown in blue, the vapor curve in green. Use the slider to display an additional P-T curve (dashed) at the ethane mole fraction selected. The critical locus (black curve) represents the critical points for all mixtures of ethane and heptane. Uncheck “show all curves” to show only the selected mole fraction and the pure components.
This simulation runs on desktop using the free Wolfram Player. Download the Wolfram Player here.
About:
This simulation was made at the University of Colorado Boulder, Department of Chemical and Biological Engineering. Authors: Adam J. Johnston and Rachael L. Baumann
View the source code for this simulation


