Clapeyron, Clausius-Clapeyron, and Antoine Equations: Interactive Simulation
This simulation was prepared using Mathematica. Download the free Wolfram player, and then download the simulation CDF file (link given below or click on figure to download). Try to predict the behavior when a parameter changes before using a slider to change that parameter. An optional activity that will increase your understanding of the Antoine equation is to carry out the digital experiment below.
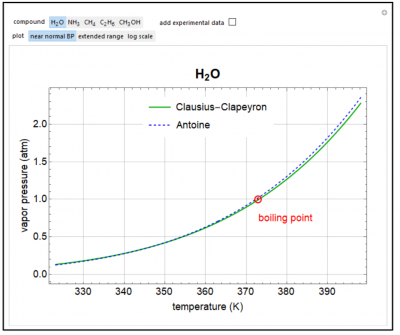
Plots the saturation pressure versus temperature predicted by the Clausius-Clapeyron equation for five molecules. Also plotted is the Antoine equation, which is obtained by a fit to experimental data. For water, click “add experimental data” to display data points. The plots of vapor pressure versus temperature are shown over a narrow temperature range near the boiling point at 1-atm pressure (click “near boiling point”) or over a range from the triple point to the critical point (click “extended range”). When log scale is selected, the log of the saturation pressure is plotted versus the inverse temperature. The heat of vaporization at the boiling point at 1-atm pressure was used for the Clausius-Clapeyron equation.
This simulation is a modification of the Wolfram Demonstration project simulation prepared by S. M. Blinder. Open content licensed under CC BY-NC-SA.
Try to answer these questions before determining the answer with the simulation. We suggest that you write down the reasons for your answers.
- Will the Clausius-Clapeyron equation or the Antoine equation provide a better fit to experimental date for water over the temperature range from the triple point to the critical point?
- Is the difference between vapor pressures obtained from the Antoine equation and those obtained from the Clausius-Clapeyron equation expected to be larger at low or high temperature when compared on a linear scale?
Determine Antoine Constants Digital Experiment


